Intro to WireShark - Diving with the Sharks

Gabriel is a professional with over 18 years of experience in the IT field providing solutions to enterprise entities across two continents and presently enjoys agnostic cloud solutions architecture.
In This brief blog post, we will take a quick glance at Wireshark, an essential investigative tool in the arsenal of professional cyber warriors and Network Pros.
WireShark as we know it today was developed by Gerald Combs in 1997 with the name of Ethereal to track down those annoying network problems and discover the “what and why” behind the network issues. Over time, a host of people contributed to its growth.

Gerald Combs
Today, Wireshark has developed into a network analysis tool used for analysis and investigation by network engineers, cybersecurity professionals and even hackers
Lab Topology
1 kali linux endpoint
- 1 taget endpoint (windows, ubuntu etc)
Task 1: Start a packet capture
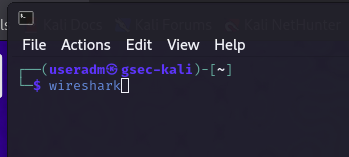
Fire up the kali endpoint and start Wireshark from the menu or open a shell and type: Wireshark at the prompt.
Note, if you are not using kali linux, you would have to install wireshark manually, this is not covered in this first part but a quick google will present you with guides for other linux platform and for Windows
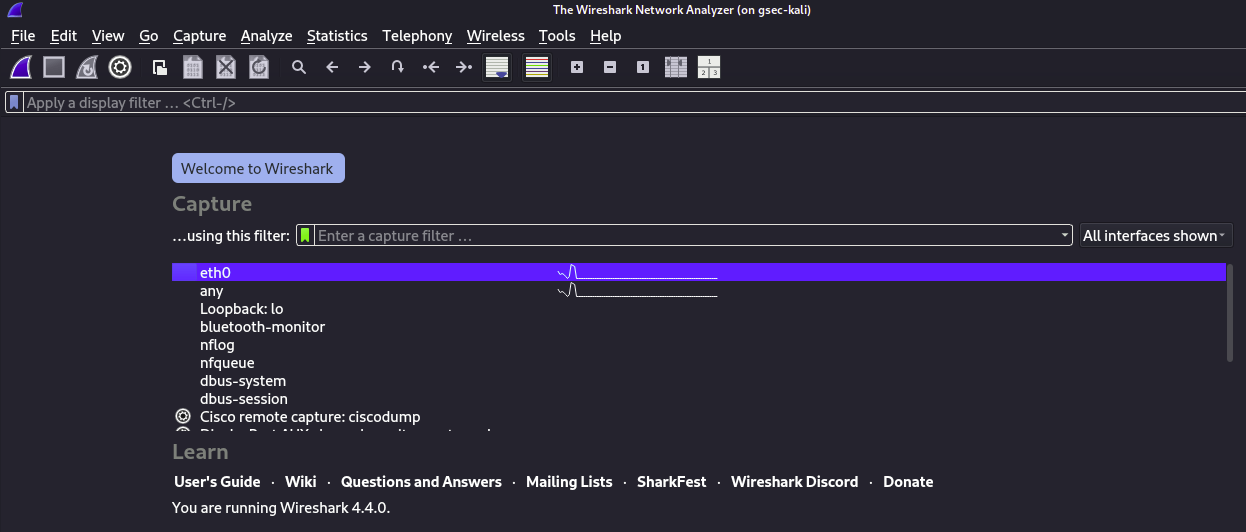
This will start the Wireshark program, be sure to select your network interface from the list presented, your network interface will be the first on the list
Wireshark immediately starts capturing network traffic based on the following criteria:
Time
source IP
Destination IP
Protocol
Length
In an instant we get over 8000 packets passing through. When investigating network events, you would want to filter out the unrelated traffic so you can get a better insight to the activities in question
Task 2: Display Filters
To do this, Wireshark uses various display filters.
- A list of these are shown below
| Filter by IP | ip.addr == 10.10.50.1 |
| Filter by Destination IP | ip.dest == 10.10.50.1 |
| Filter by Source IP | ip.src == 10.10.50.1 |
| Filter by IP range | ip.addr >= 10.10.50.1 and ip.addr <= 10.10.50.100 |
| Filter by Multiple IPs | ip.addr == 10.10.50.1 and ip.addr == 10.10.50.100 |
| Filter out/ Exclude IP address | !(ip.addr == 10.10.50.1) |
| Capture Filter | host <host IP address>host |
| Filter IP subnet | ip.addr == 10.10.50.1/24 |
| Filter by multiple specified IP subnets | ip.addr == 10.10.50.1/24 and ip.addr == 10.10.51.1/24 |
| Filter by Protocol | dns |
| http | |
| ftp | |
| ssh | |
| arp | |
| telnet | |
| icmp | |
| Filter by port (TCP) | tcp.port == 25 |
| Filter by destination port (TCP) | tcp.dstport == 23 |
| Filter by ip address and port | ip.addr == 10.10.50.1 and Tcp.port == 25 |
| Filter by URL | http.host == “host name” |
| Filter by time stamp | frame.time >= “June 02, 2019 18:04:00” |
| Filter SYN flag | tcp.flags.syn == 1 |
| tcp.flags.syn == 1 | |
| tcp.flags.ack == 0 | |
| Beacon Filter | wlan.fc.type_subtype = 0x08 |
| broadcast filter | eth.dst == ff:ff:ff:ff:ff:ff |
| Multicast filter | (eth.dst[0] & 1) |
| Host name filter | ip.host = hostname |
| MAC address filter | eth.addr == 00:70:f4:23:18:c4 |
| RST flag filter | tcp.flags.reset == |
To demonstrate the filter functions, we will do some filtering
Lets sort by IP address, note, you can sort by source, destination, IP address range and multiple Ip addresses
I will be sorting for my Windows 11 endpoint with its IP: 192.178.30.92
The command is :
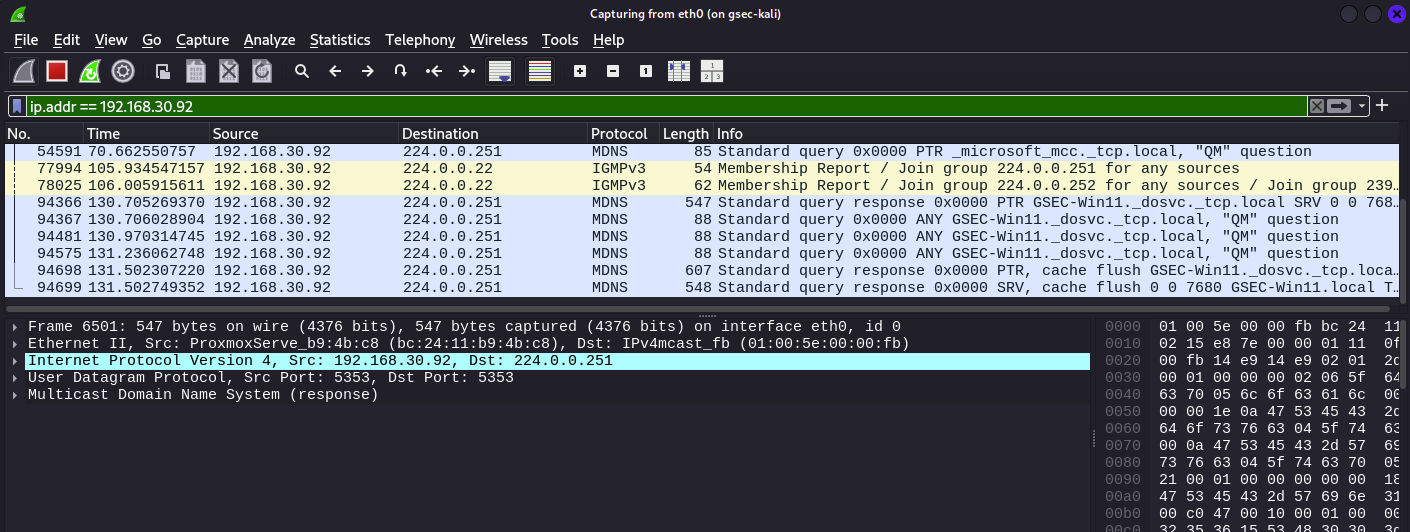
ip.addr == 192.168.30.92
Never mind the javascript in the image, its not related
This filters out all traffic that is not sourced or destined for 192.168.30.92
Next lets try filtering by port numbers, options include: 80, 22, 443, 21 etc lets try 80 first, given that these are lab devices we might and might not get any output
The command is :
tcp.port == 80 || udp.port == 80
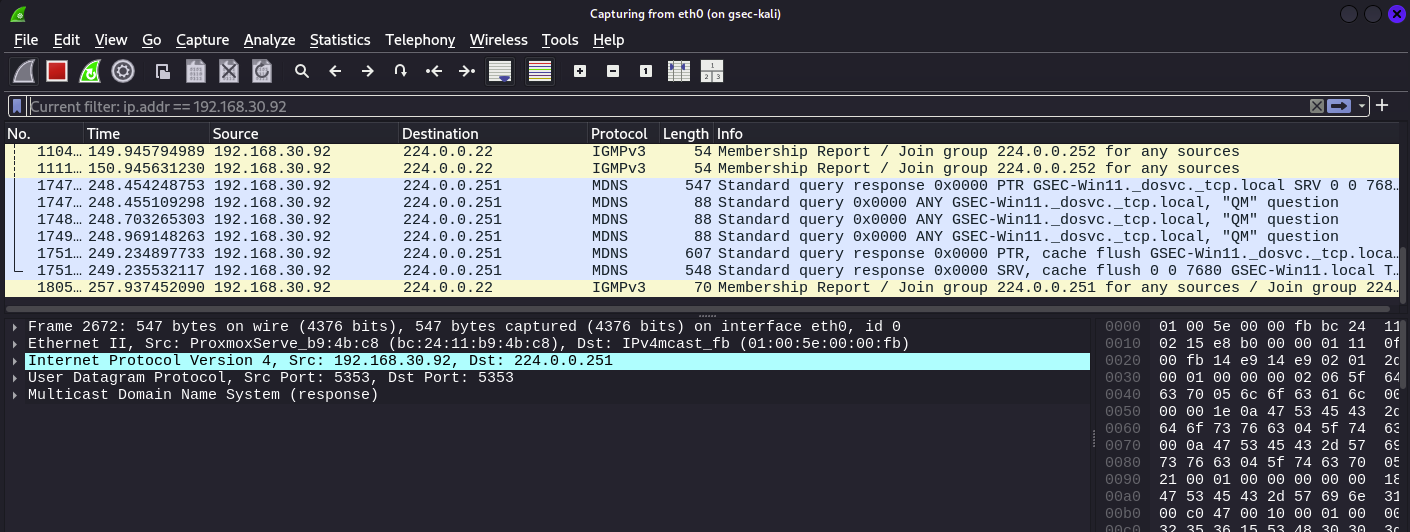
As you can see we didn’t get any TCP/UDP protocol in the output.
To help this, lets browse a bit
lets fire up Firefox and play around the internet
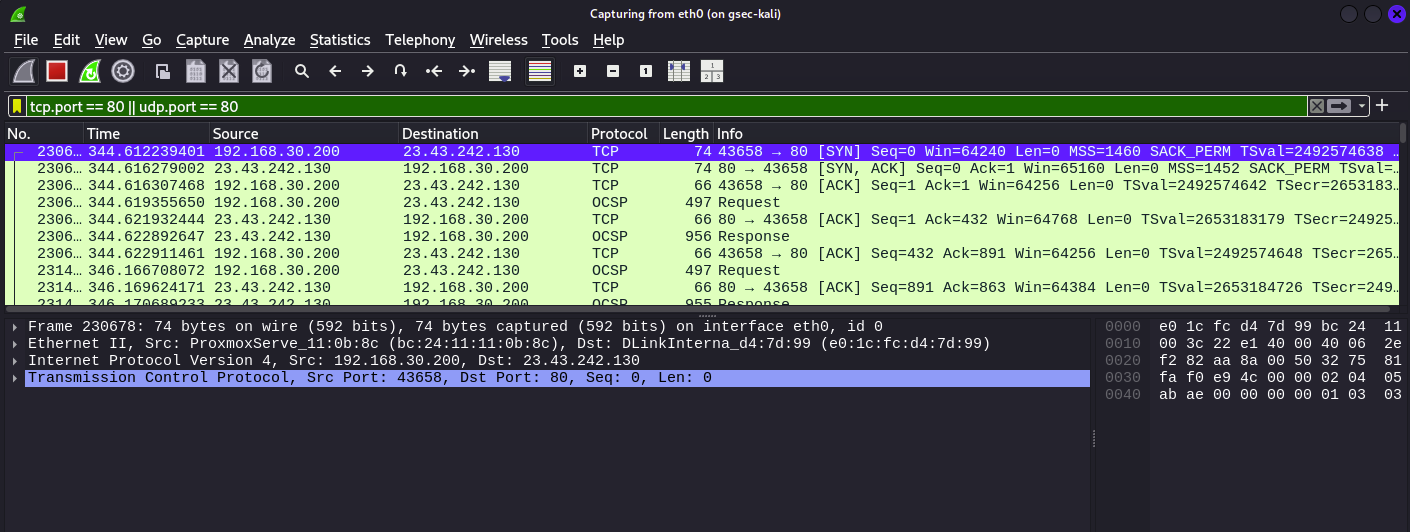
After browsing a bit, we see tcp packets in the network traffic showing up
Next lets inspect a packet to see what type of information we can glean
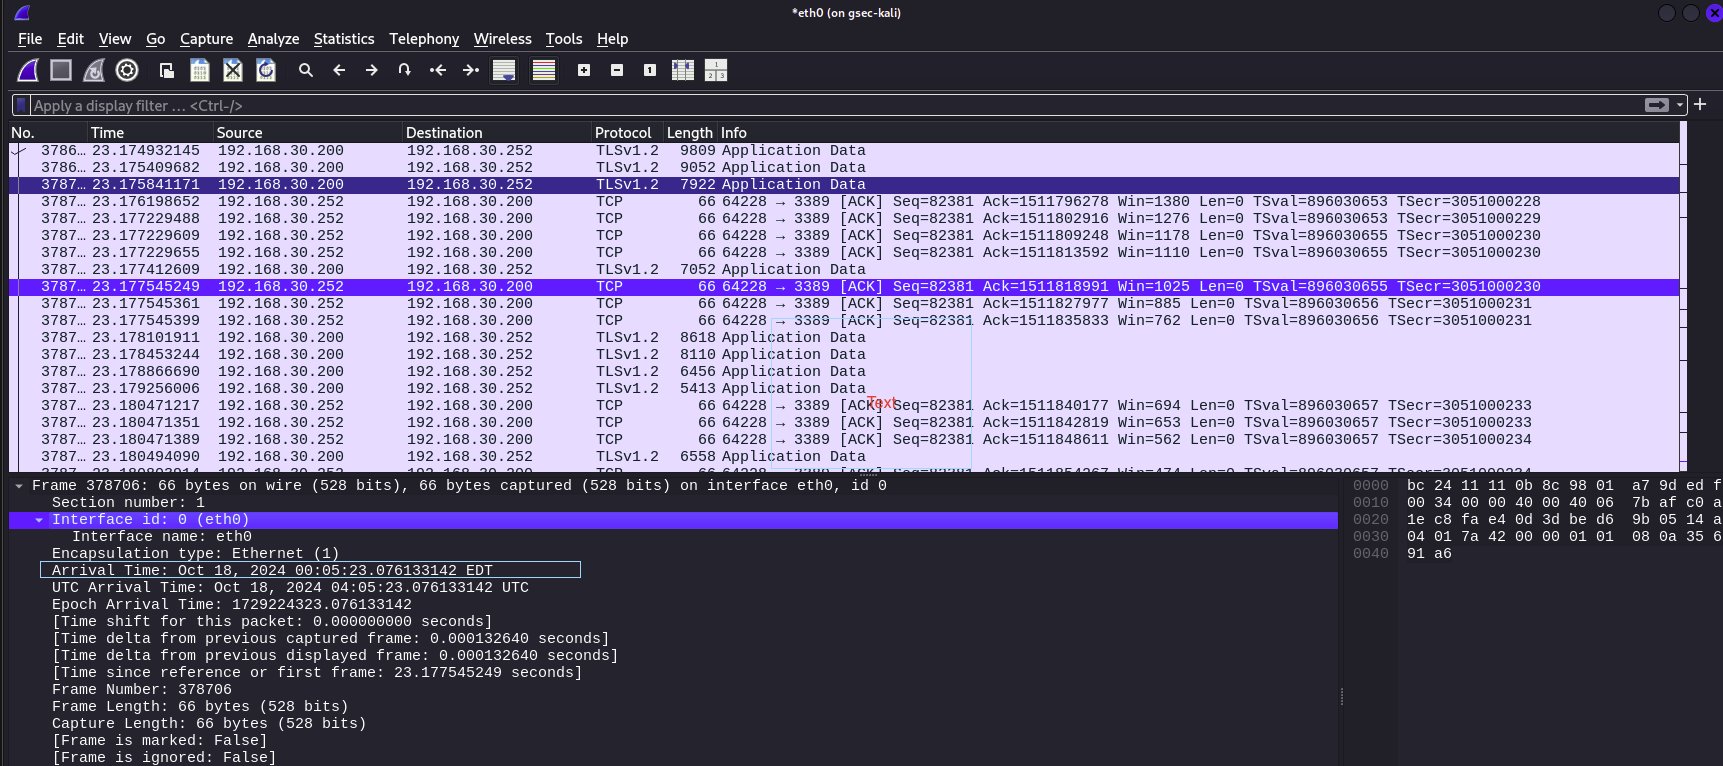
Looking at the packet under frames, we can deduce the following:
The size of the frame: 66 bytes
The interface it originated from: eth0
The arrival date and time, thats when it was captured:18th Oct 2024 00:05:23 EDT
Protocols in the frame: eth:ethertype:ip:tcp
This line reveals whats in multiple layers of the OSI from layer 2 to 5
Next we will review the Ethernet part of the captured frame
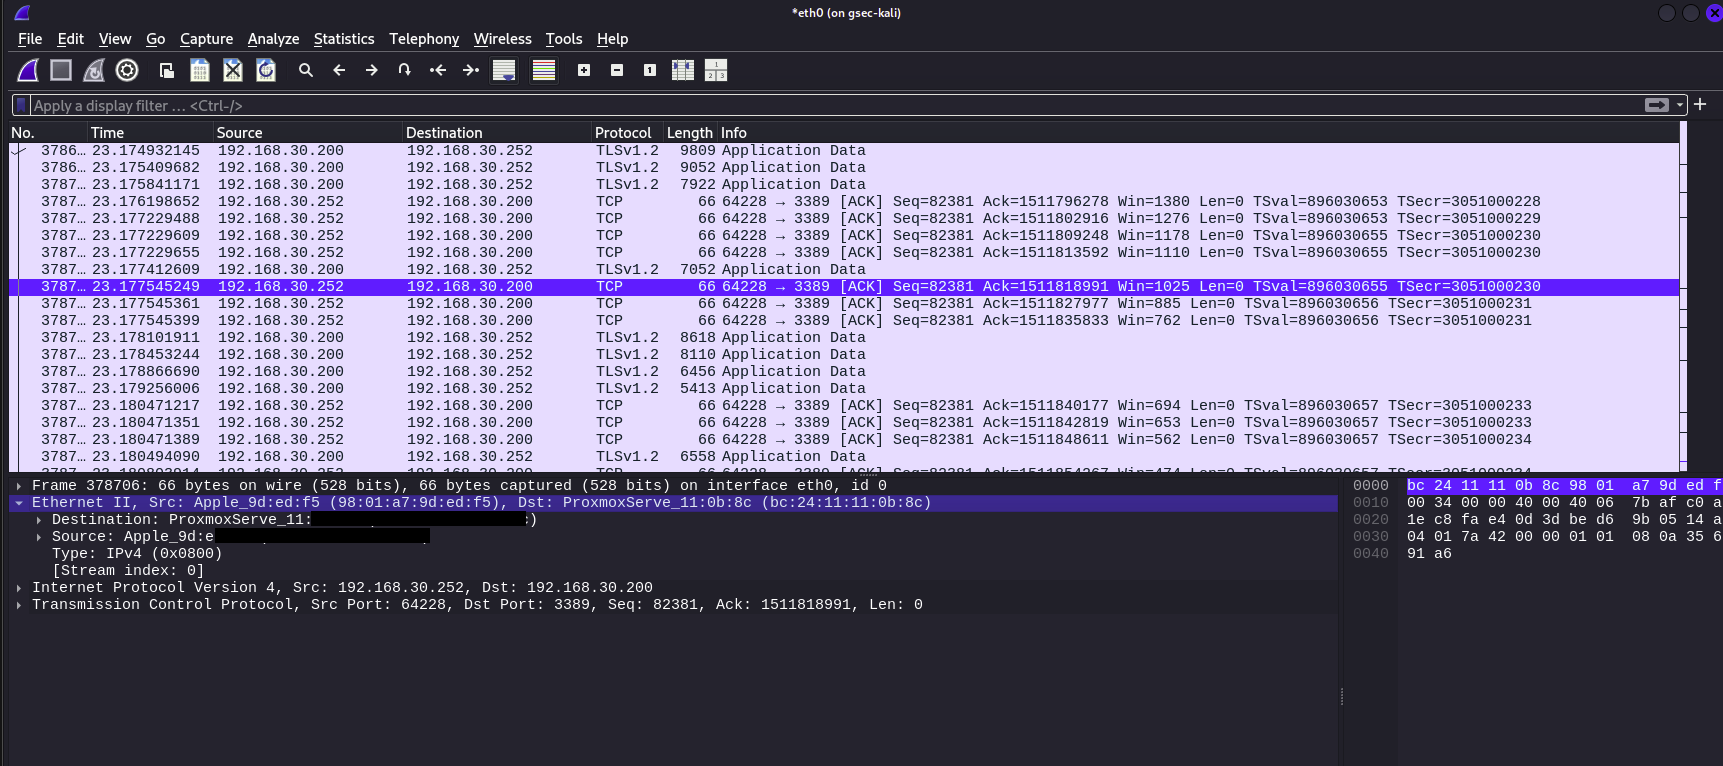
- Reviewing the output shows the source and destination MAC addresses
The internet protocols part of the packet reveals
The protocol in play: TCP
The source and destination IP addresses in play
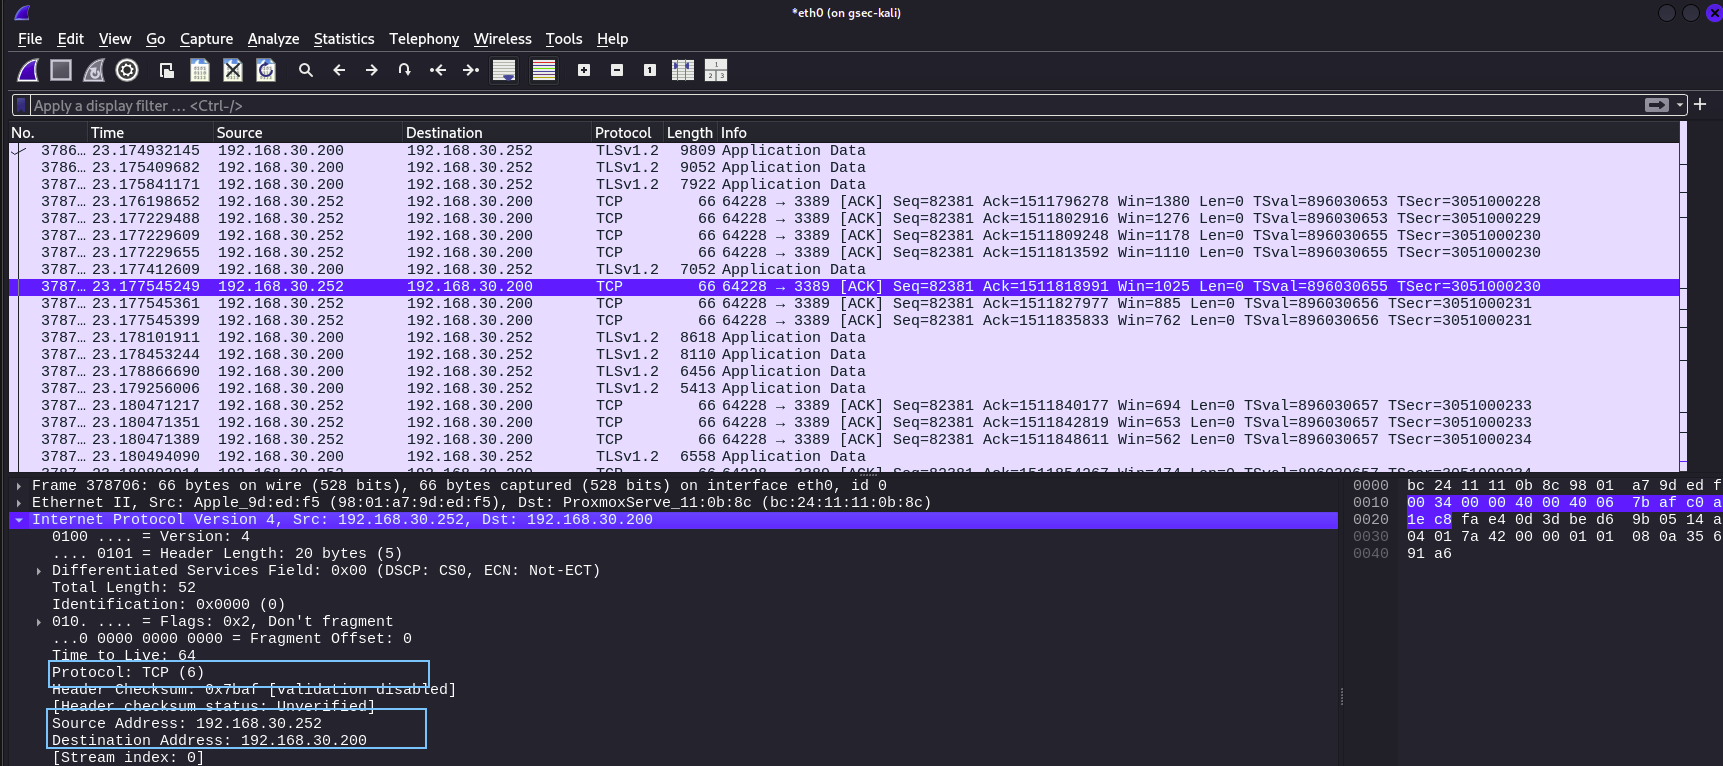
The TCP part of the packet shows :
Source Port, Destination Port
Time Stamps
Header length
Check Sums, Flags
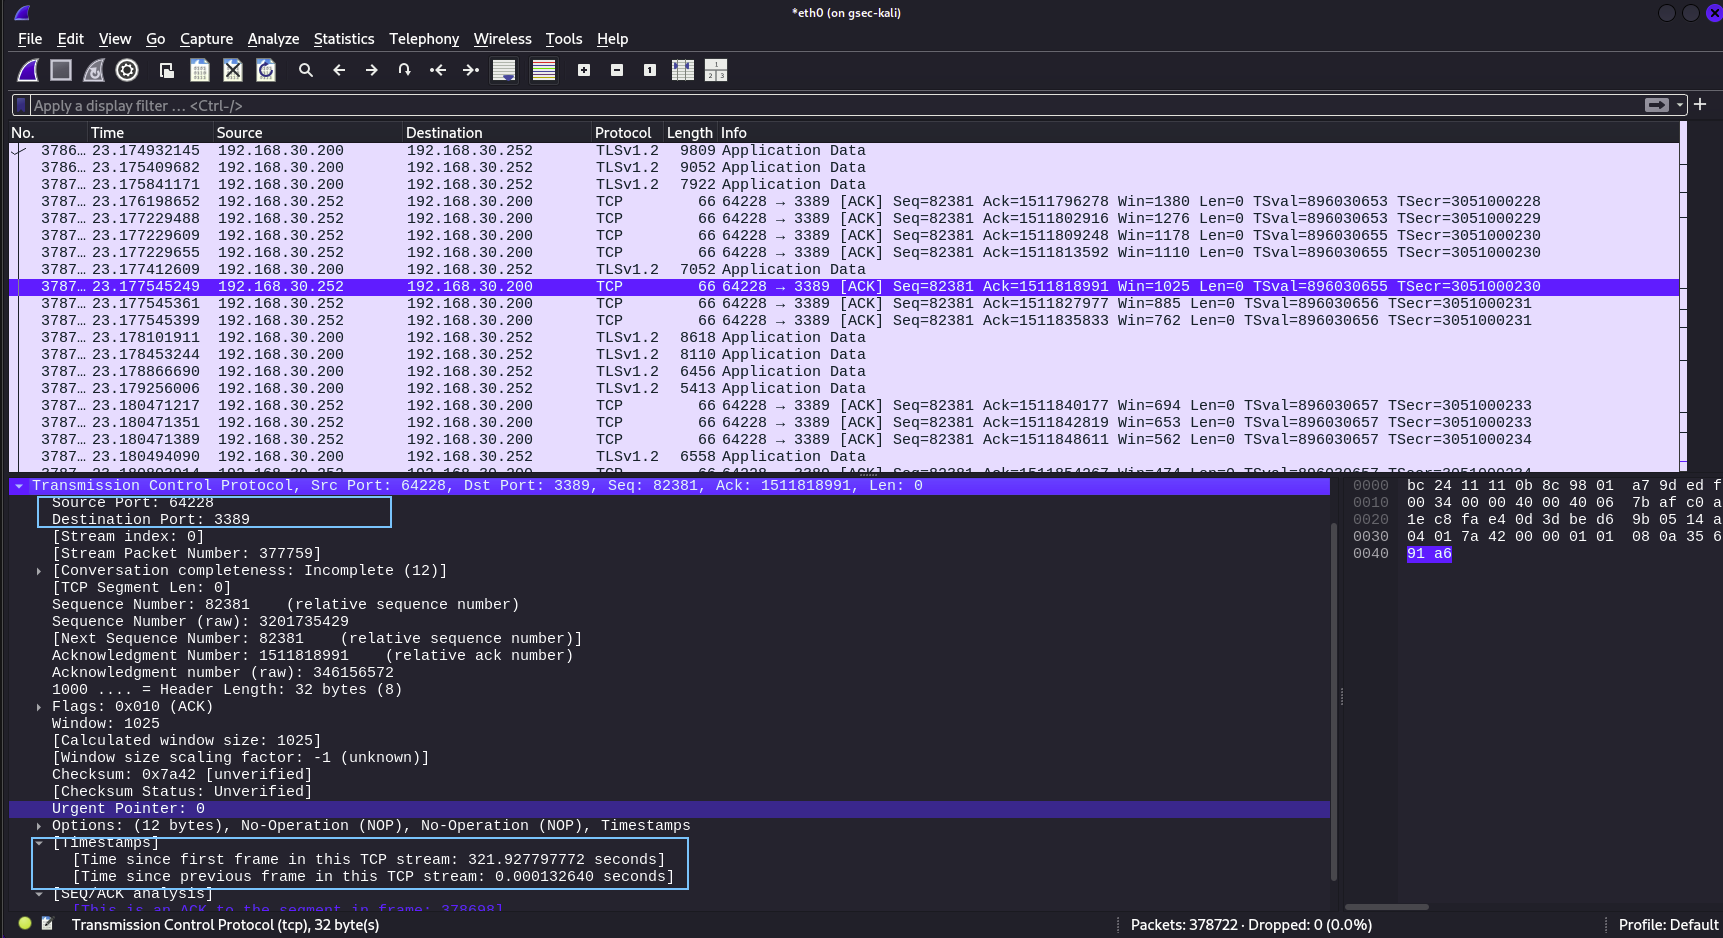
You can see at a glance that we are able to use the information from the captured packet to deduce a lot about the traffic this packet is a part of and this will aid our investigation when a network or cyber issue occurs.
Developing the eyes and instinct to sniff out the important information that relates to the objective at hand while ignoring the fluff is a vital skill for any cybersecurity practitioner
I hope this has given you enough confidence to go jump off the not so deep end and get your feet wet! HAPPY DIVING!!!!


